Making sense of different PVIs
There are, right now, three different, publicly available, Minnesota-centric, PVIs… that I know of.
There is the MinnPost PVI (which I will refer to as mPVI from here on out), that uses the last three cycles of partisan legislative election results to formulate its number. There is the Common Cause PVI (cPVI), which uses the partisan results of the most recent constitutional officers races; Secretary of State, Attorney General and Auditor. And there is of course hPVI (hPVI), which I started doing back in 2010. hPVI uses the partisan results of the most recent Gubernatorial and Presidential elections.
The three metrics use non-overlapping data, which is helpful for the purposes of this post, but also sheds light on the different theories they operate under.
With hPVI, my intent was simply to mimic PVI, but to use a set of state numbers along with the most recent Presidential numbers. I chose to use the numbers from Gubernatorial elections for no other reason, really, than wanting to be as true as possible to the original intent of PVI. I thought the Gubernatorial numbers did this best.
The theory behind using numbers from the constitutional officer races, as cPVI does, is that these are low information races, at least compared to Governor, so voters will be that much more inclined to vote their partisan preferences.
The theory behind using the numbers from the legislative races themselves, as mPVI does, is that that is what actually happened in the district in legislative races in the past.
Essentially, hPVI and cPVI are on one end of a spectrum, with mPVI is on the other. With both hPVI and cPVI, numbers from races other than legislative races are used to predict legislative races, while with mPVI numbers from actual legislative races are used to predict legislative races.
The difference is like the difference between ERA and FIP. ERA is a measure of the number of runs a pitcher has actually given up, while FIP (Fielding Independent Pitching) is a measure of what a pitchers ERA “should” be based on his fielding-independent pitching stats; strikeouts, walks and home runs allowed.
The thing is, FIP tends to do a better job of predicting future ERA, than ERA itself does. There are exceptions to this, some pitchers can consistently over perform their FIP, while others will under perform it with regularity, but these are exceptions.
Jim Oberstar would routinely get well over 60% of the vote, in a district with a partisan index that indicated he should be getting more like 55%. There are exceptions to PVI like there are exceptions to FIP.
In this post I’m going to use these three different versions of PVI to predict past elections in the state and see how they fair. The purpose of this post is not to say definitively that one metric is better than another, but rather is the outgrowth of my own curiosity on the matter.
It all started when MinnPost released their version of PVI.
When using just the election data from legislative races, as the MinnPost PVI does, you are getting past the partisan fundamentals and more into hyper locality. That is, Democrats running in conservative districts tend to be more conservative and Republicans running in liberal districts tend to be more liberal.
By backing out the numbers you are using to statewide races, or in the case of the original PVI, the Cook PVI, Presidential races, you are removing this local noise from the numbers and more accurately getting at the partisan fundamentals.
Not only that, some candidates are just plain better at campaigning than others and this gets reflected in the legislative race numbers. And while you have the same issue statewide, you can compare a candidates performance in a district to their performance statewide to get a partisan number that removes the quality of the candidate from the equation.
At least, that’s the theory.
Had I ever bothered to actually check it out though?
This was the thought that kept nagging at me because, of course, the answer was no, I hadn’t bothered to check it out.
This post than is the result of my research into how these three metrics perform when used to do what they are supposed to do, predict elections.
The years that I am trying to predict are 2008 and 2010. I am limiting my query to these years because mPVI requires the past three legislative elections be used and so to have an mPVI in 2006 I would need info from 2004, 2002 and 2000. The problem of course is that redistricting occurred between the 2000 and 2002 elections. So to save myself even more excel work, I’m only using 2008 and 2010.
Those two years yields 335 legislative races, but in six of those races there was either no Democrat or no Republican, so I didn’t use those. After all, what’s the point of trying to predict a race with one candidate?
That still left me with 329 data points, a fairly decent sample size, but by no means comprehensive. So, take these results for what they’re worth.
What I did was to calculate the three different metrics, as they would have been during the cycle that I’m using them to predict. So in predicting the 2008 cycle I am using the PVIs that would have been out at the time, had any of them been in existence then, which none of them were.
Here then, is what I found.
| Metric | Correlation | r2 |
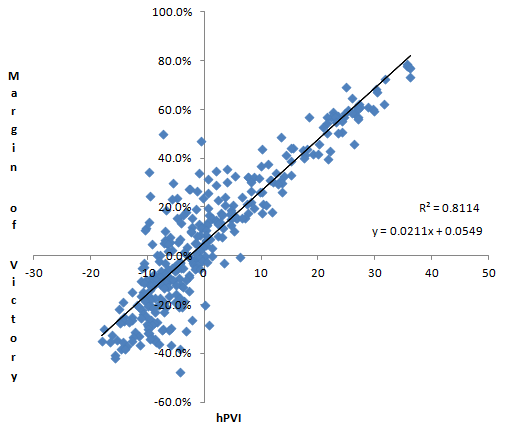
| hPVI | .9008 | .8114 |
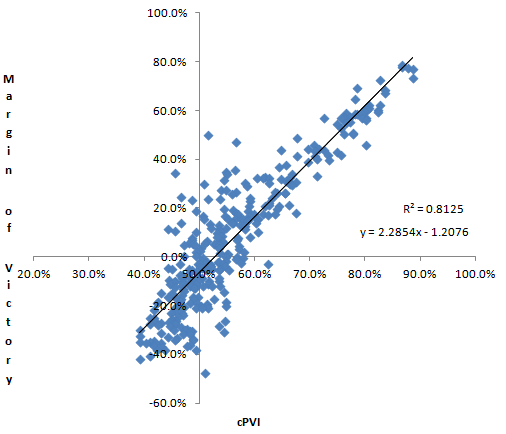
| cPVI | .9014 | .8125 |
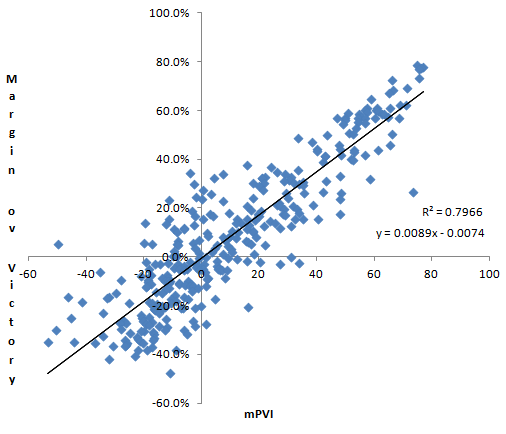
| mPVI | .8925 | .7966 |
All three systems had very strong correlations with the election results of the years they were trying to predict; the three metric’s correlations were almost identical in fact.
But just looking at the scatter plots, you can see a difference.


Which one is not like the others?
The cPVI and hPVI scatter plots look pretty similar to each other and quite a bit different from the mPVI plot. The differences are obvious, the dots are not nearly as closely bunched around the regression line, so while the correlation is roughly the same, the variances are quite a bit different.
Looking at the root-mean-square deviation of the three PVI’s more clearly reveals these differences. The root-mean-square deviation is essentially the average error, so the lower the number, the more accurate the prediction.
| Metric | RMSD |
| hPVI | 6.37 |
| cPVI | 6.93 |
| mPVI | 7.71 |
As you can see, mPVI has more inherent error than the other two methods, with hPVI fairing the best by this measure. So that’s that right? They all do a pretty good job, but the legislator-independent (to borrow a baseball phrasing) indexes are more accurate.
But wait… The story doesn’t end there.
After doing all of this, I then thought to myself, self, what happens if we do something crazy, like start to combine these metrics together into yet different metrics.
Well, that’s when some interesting things begin to happen, the kinds of things that will have to wait for a future post I’m afraid.
Thanks for your feedback. If we like what you have to say, it may appear in a future post of reader reactions.


